My AI Portfolio Reviewer, Part 2: How Fast an AI System Gets Expensive — A $5 Bill, 104K Tokens, and the Many Ways to Cut Token Costs
A $5 monthly Claude bill, a 104K-token spike, and everything I changed to bring it down. Part 2 of a 3-part series.
📖 Preface
Part 1 was about the system — the pipeline, the staging, why Claude only ever steps in once, for one real judgment call. This one is about the money side of that: what it actually costs to run that judgment call every month, what surprised me about the bill, what I changed, and what I learned along the way — some of it good, some of it not. Part 3 is still on hold, waiting on real hardware.
Same rule as before: everything here comes from real numbers, pulled straight from a table I built to track this. Let’s get into it. 💸
🎯 Intro
This didn’t start after the pipeline went live — it started while I was still building it. I was just curious what running Claude through this would actually cost, so before wiring anything into production I added some credits and started testing.
First mix-up: I assumed the API cost and my Claude subscription were the same thing. They’re not. The subscription is a flat monthly plan for using Claude the assistant — the API is billed separately, pay-as-you-go, and it’s what this pipeline actually runs on.
So I added $20 in API credits to test with. It was gone after a handful of test runs. I added another $10, thinking that would buy me more room to experiment — it lasted two or three calls. That’s when the real cost analysis started: not curiosity anymore, but “I need to know exactly where this money is going before I let this run unattended every month.”
💰 The bill showed up
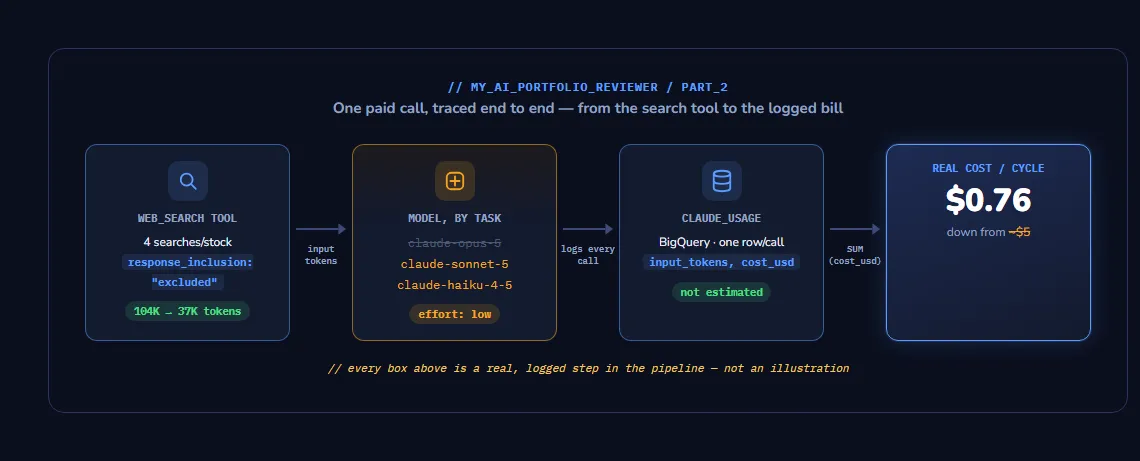
Once I actually sat down to measure it, the picture got clear fast. Stage B is the one step in this whole pipeline where Claude actually looks at a stock and forms an opinion — the only place that spends real money. In its early version, it was running on Opus (the strongest, priciest model available), with the reasoning effort turned up to “medium”, and no limit yet on how much it could search the web for each stock. That setup worked out to about $5 for a full monthly cycle — roughly 4 to 6 stocks getting a Stage B review.
On paper, $5 isn’t much. But watching $20, then $10, disappear in a handful
of calls during testing told a different story — this wasn’t a task that
should be burning money that fast. So I built a claude_usage BigQuery
table: one row per API call, logging model, input tokens, output tokens, and
cost_usd, tagged with the run_id and stock symbol.
That’s the actual run_id=2026-08-20 cycle, straight out of the table — not
a mockup:
| Call | Model | Input tokens | Output tokens | Cost |
|---|---|---|---|---|
| IRCTC | Sonnet 5 | 78,981 | 1,998 | $0.178 |
| ITC | Sonnet 5 | 79,968 | 2,861 | $0.189 |
| JYOTIRES | Sonnet 5 | 75,273 | 2,466 | $0.175 |
| KSOLVES | Sonnet 5 | 51,484 | 1,509 | $0.118 |
| PIIND | Sonnet 5 | 44,177 | 1,161 | $0.100 |
| gsr_lookup | Haiku 4.5 | 9,867 | 138 | $0.011 |
| notes | Haiku 4.5 | 410 | 108 | $0.001 |
| Full cycle — 7 calls | $0.77 |
🔍 How the whole thing is tracked
The mechanism is simple:
- Every call — Stage B, the notes call, the gold-silver price lookup, all of it — passes through one function before its result gets used for anything else.
- That function reads the token counts (
input_tokens,output_tokens) straight off the API’s own response. - It prices those tokens against a small hardcoded rate table — Opus 5 at $5/$25 per million input/output tokens, Sonnet 5 at $2/$10, Haiku 4.5 at $1/$5, checked against Anthropic’s published rates. This math never touches the API itself — it’s just arithmetic on numbers already handed back.
- It writes one row per call to
zerodha_pipeline.claude_usage:run_id,call_type, stock symbol, model, input tokens, output tokens, cost, and a timestamp. - The email’s cost badge is just a sum of that run’s rows.
That table is what everything below is built on. Every number past this point is a logged row I queried directly, not a memory or an estimate — which is also, not incidentally, what made it possible to write this article honestly instead of from recollection.
📊 First finding: input tokens dominate, and they can spike hard
Real per-token pricing (checked against the Claude API pricing page):
| Model | Input ($/M tokens) | Output ($/M tokens) |
|---|---|---|
| Opus 5 | $5 | $25 |
| Sonnet 5 | $2 | $10 |
| Haiku 4.5 | $1 | $5 |
- Opus:Sonnet is only a 2.5x price gap — not the ~5x I’d assumed before actually checking. That wrong assumption would’ve made me over-value “downgrade the model” as a fix, and miss what was actually driving cost.
- The real driver: input tokens — specifically, what web search pulls into context.
- The
claude_usagetable caught it directly: one Stage B call on PIIND logged 104,529 input tokens. - Cause: one specific domain returned a full earnings-call transcript into the search result — not a summary, the whole transcript.
- Fix: added that domain (
investywise.com) to a blocklist on the search tool. - Result: same stock, about an hour later — 37,217 input tokens, a 64% drop, same analysis quality, from one line of config.
That felt like the fix. It wasn’t the fix — it was one blocklist entry. More on that below.
🎛️ The tuning decisions, in order
- Model split by task —
claude-opus-5everywhere →claude-sonnet-5for the judgment call,claude-haiku-4-5for the trivial one-line notes. Opus’s depth isn’t needed to write an 8-word note. - Reasoning effort —
"medium"→"low". Stage B’s prompt is already tightly scoped (four fixed questions); lower effort didn’t hurt verdict quality. - Web search ceiling — untuned → capped at 4 searches/stock (down from 5), with a floor of 2. Search volume, not reasoning, was the dominant cost driver.
- Search tool response — full search content echoed back →
response_inclusion: "excluded". This pipeline is single-turn; it never needs the raw search content again after the model has used it. - Domain blocklist — none → evidence-based, grown from real
claude_usageoutliers (the 104K→37K PIIND fix above).
Put simply: from nearly $5 a cycle on Opus with the effort dial turned up, down to a real, logged $0.77–$1.24 per cycle today — roughly 3-6x cheaper, moving cycle to cycle with how much that month’s web searches happen to pull back.
The real end-to-end email footer, from an actual production run
(run_id=2026-08-20, 5 stocks evaluated):
This run cost ~$0.76 (~₹66) in Claude API usageThat’s a cent under the $0.77 I get summing all 7 logged rows myself — the email’s own running total doesn’t include the free-standing GSR lookup call, just the Stage B and notes calls. A small gap, but worth being precise about rather than rounding it away.

⚠️ Two things the tuning didn’t fix
1. New outliers keep appearing. The domain blocklist only stops a source after it’s already cost money once — so new ones just keep slipping through:
- ITC — 155,106 input tokens, $0.35 in a single call. The worst call in the whole log, worse than the original PIIND outlier that triggered the blocklist fix in the first place.
- PIIND (the same stock from that fix) — spiked back up to 90,763 tokens on one later run, then 103,342 on another. From a different cause, not yet blocked.
- IRCTC — 127,837 input tokens on the most recent run.
- JYOTIRES — 125,672 input tokens on the most recent run.
This isn’t a solved problem. It’s a queue of not-yet-caught ones.
2. A retry silently doubles the bill.
- The $0.77 clean-pass number earlier in this piece is real — but it’s not the whole story for that cycle.
- The same
run_idalso has a same-day retry batch logged against it: all 5 stocks evaluated a second time, after an earlier partial failure. - That pushed the cycle’s actual total to $1.75.
The pipeline degrades gracefully by retrying, and “gracefully” has a price tag nobody sees unless they’re looking at the log directly — not the email footer from a single pass.
🚫 Two “obvious” optimizations that made things worse
Not every lever pulls the direction you’d expect. Two are worth sharing because they’re the kind of thing that looks right on paper.
Switching Stage B fully to Haiku. Half of Sonnet’s sticker price — should be cheaper, right? Tested it directly:
- Haiku doesn’t support the
effortparameter at all — a straight400on the API call. - Haiku can’t do dynamic tool filtering — it can’t intelligently narrow search results mid-call the way Sonnet can. It either reads a result in full or not at all.
- To compensate for losing that judgment, the search budget had to widen — which meant searching more, not smarter.
- Net effect: total token volume climbed enough that the run ended up noticeably more expensive than Sonnet overall, despite the lower per-token rate. Cheaper model, more expensive outcome.
Narrowing to an allowlist of trusted domains. For two thinly-covered small-cap stocks, I tried restricting search to a few trusted finance domains instead of blocking a few bad ones.
- Intuition: fewer, better sources should mean less searching.
- Real result: cost got meaningfully worse for at least one of those stocks — the model kept searching within the narrow allowlist, not finding enough, and trying again.
- Lesson: an open search space that finds a good source on the first try beats a restricted one that has to hunt.
One more gotcha, if you’re using the web_search tool:
moneycontrol.com and economictimes.indiatimes.com actively block
Anthropic’s search crawler and get rejected outright by the API if you list
them in either allowed_domains or blocked_domains. Found that one the
hard way.
🐛 The bug that got through anyway
All of the above still didn’t prevent a real production incident:
- The trivial notes call (Haiku) had a leftover
output_config={"effort": "low"}from an earlier version of the code — Haiku doesn’t support that parameter. - It failed silently, on every run. The pipeline caught the exception and degraded gracefully — Stage B/C still worked, so an email still sent.
- But every email was quietly missing its portfolio-value summary block. Nobody noticed, because nothing looked broken — just quieter than it should’ve been.
- I found it because I triggered a real production run against that day’s actual holdings sheet and read the response myself — not because a unit test caught it.
Takeaway for anyone building an LLM-in-the-loop pipeline: exception handling that degrades gracefully is good practice, but it also means a real bug can hide behind a technically-successful run. Trigger it for real, periodically, and actually read what came back — don’t just check the HTTP status code.
🧠 Knowing when not to call the model
The pipeline’s most recent addition is an “Equity Allocation Parity” diagnostic:
- A concentration score (Herfindahl-Hirschman Index), weight-distribution bands, and the 5 most under/overweight stocks in my equity book.
- Entirely pure Python. Zero Claude calls.
- Computed straight from the same holdings data Stage A already reads, because none of it is a judgment call — it’s arithmetic.
That’s the real skill this project reinforced for me, more than any single tuning trick above: being a data engineer who leverages AI well isn’t about routing everything through a model. It’s architecting so the model only ever sits in the one place actual judgment is required, instrumenting that one place properly, and being willing to rip out an “obvious” optimization the moment the real numbers say it made things worse.
Claude didn’t make this pipeline disciplined. The staging, the cost table, the willingness to reverse a decision that looked right on paper — all of that had to exist first. Claude just got to be the one piece of judgment none of it could replace.
🔮 Where retrieval might go next
The domain blocklist is a reactive fix — it only stops a source after it’s already cost money once (see the outliers above). That’s because web search’s token cost is a function of whatever content the tool happens to pull back on a given day, and that’s fundamentally unbounded. On top of that, Stage B starts from zero every single cycle: it searches the open web for a stock it may well have evaluated before, with no memory of what it concluded last time, or why.
Retrieval-augmented generation (RAG) is the direction that could fix both problems at once — and it’s specifically the bounded-context property of RAG that matters here, not just “give the model memory”:
- Every Stage B verdict already lands in BigQuery with its full rationale, sources, and confidence score — a knowledge base sitting there unused.
- Chunk and embed it, put it behind a vector store, and a future Stage B could retrieve a fixed number of its own prior reasoning chunks — a chosen chunk size, a chosen top-k.
- That replaces an open-ended web search that might return a two-line summary or a full transcript depending on what a random domain happens to serve that day.
- The input token count for that retrieved context becomes something I decide in advance, not something I find out after the bill arrives.
- The same pattern could extend to the GSR/equity-parity diagnostics too — retrieving prior months’ concentration trend instead of only ever comparing to the single most recent run.
This is deliberately framed as a direction, not a result — nothing above is built yet. But the pieces are already close: BigQuery’s vector search and Vertex AI Vector Search are both already in reach of this stack, and Stage B’s own historical output is exactly the kind of grounded, first-party data a RAG system should be built on, rather than reaching for the open web for something the pipeline already figured out once. When it’s actually built, it’s getting its own write-up — not a footnote here.
Part 1 covers the system this all sits inside of — the goal, the architecture, and the reasoning behind the staging in the first place. Part 3 (on hold until there’s something real to show) covers putting the results on a physical screen. The RAG direction above will get its own dedicated article once it’s actually built.